
You grabbed a case of water for convenience, saw the headline that it’s full of plastic, and now you want to know which brand to trust. The honest answer is that none has earned that trust yet.
At a glance
- Best for everyday home use: filtered tap water in glass or stainless steel
- Best for travel or emergencies: water in glass bottles, kept cool and out of the sun
- Best for checking a brand’s reputation: don’t. No test here found a brand with zero particles
- Best for current-brand curiosity: the 2026 Los Angeles test, where Path scored lowest (106) and Dasani highest (143)
- Best for the biggest sample: the 2018 Orb Media study of 259 bottles
The Verdict: No Brand Is Proven Microplastic-Free
Every bottled water brand that has been tested showed microplastic particles, and none has been shown to be clean. Some readings are lower than others, but a lower reading isn’t a safe label.
This article compares four options: plastic bottles, aluminum cans, glass bottles and filtered tap. The brand rankings you may have seen online come from different methods, so they can’t be merged into one list. Where one test says “143” and another says “930,” those numbers measure different things.
Below you’ll find a table of what each test found, a short guide to reading the numbers, the results by test, and a simple swap plan. If you’re wondering which brand has the least, there’s no verified microplastic-free brand to point to. The best anyone can say is which brand scored lowest in a single test on a single day.
Brand-by-Brand Results at a Glance
Each brand below was positive in at least one test, but the studies measured different things, so the rows can’t be ranked against each other. Read each row on its own and pay attention to the metric and caveat columns.
| Brand | Container | Study and year | Metric | Result | Caveat |
|---|---|---|---|---|---|
| Dasani | Plastic bottle (typical) | LA test, 2026 | Fluorescence score | 143 (highest of 7) | One store, LA; score is signal strength, not a count |
| Liquid Death | Aluminum can | LA test, 2026 | Fluorescence score | 141 | One store, LA; one date |
| Path | Not specified | LA test, 2026 | Fluorescence score | 106 (lowest of 7) | Still showed a clear PET signal |
| Fiji | Plastic bottle (typical) | LA test, 2026 | Fluorescence score | Positive, between 106 and 143 | One store, LA |
| Evian | Plastic bottle (typical) | LA test, 2026 | Fluorescence score | Positive, between 106 and 143 | One store, LA |
| Crystal Geyser | Plastic bottle (typical) | LA test, 2026 | Fluorescence score | Positive, between 106 and 143 | One store, LA |
| San Pellegrino | Not specified | LA test, 2026 | Fluorescence score | Positive, between 106 and 143 | One store, LA |
| Nestlé Pure Life | Plastic | Orb Media / SUNY Fredonia, 2018 | Particles per liter (lot mean averaged by brand) | 930 | Bottles bought in nine countries; smaller particles not confirmed by spectroscopy |
| Gerolsteiner | Plastic | Orb Media / SUNY Fredonia, 2018 | Particles per liter (lot mean averaged by brand) | 807 | Same as above |
| Three unnamed brands | Not stated | Nanoplastics study, 2024 | Particles per liter | About 240,000 average | Brand not named, so no brand can be assigned a number |
Why can’t you rank these rows? A fluorescence score tells you how strongly a sample glowed under a test. A particles-per-liter figure counts individual particles. A 2018 count of 930 isn’t “worse” than a 2026 score of 143, because they’re different units from different labs using different tools.
How to Read These Numbers
A fluorescence score, a particles-per-liter count and a single-bottle maximum answer different questions, so only compare numbers from the same test. Think of each as a different kind of ruler.
Microplastics are plastic pieces smaller than 5 millimeters. Nanoplastics are far smaller still, so small that older methods couldn’t see them. Newer tools can, and that changes the totals dramatically.
Here’s what the common labels mean:
- Single-bottle maximum: the worst bottle found. In 2018, contamination ranged from 0 to over 10,000 particles per liter across bottles.
- Lot mean: the average across bottles from one production batch.
- Brand mean: lot means averaged again by brand. The 2018 brand figures in the table are of this type.
- Fluorescence score: signal strength from the 2026 test. It isn’t a particle count.
The 2024 nanoplastics study is the trickiest. It averaged about 240,000 particles per liter across three brands, roughly 90% of them nanoplastics, but it never named the brands. You can’t use it to say anything about Dasani, Evian or any other label.
That 240,000 figure is roughly 739 times the 2018 average of 325 particles per liter. Mostly that reflects detection tools, not a suddenly dirtier product. The 2018 method couldn’t see the tiny stuff, and the 2024 method could.
Results: Most and Least by Test
The highest and lowest brands change from test to test, and no test found a brand with zero particles. Treat each result as a snapshot of that study’s method.
The biggest was the 2018 work by Orb Media with researchers at SUNY Fredonia, led by Sherri Mason. It examined 259 bottles from 11 brands, bought at 19 locations. About 93% of bottles showed some sign of microplastic contamination. After background correction, bottles averaged 10.4 particles larger than 100 µm per liter, and 325 per liter once smaller particles (6.5 to 100 µm) were included. The highest brand means were Nestlé Pure Life at 930 and Gerolsteiner at 807 particles per liter.
The 2026 test bought seven brands at a single Los Angeles grocery store and screened them by fluorescence. It was Round 1 of 12 in a larger series, and its organizers say the scores show degrees of particle load, not a clean winner. Dasani scored highest at 143. Path scored lowest at 106, but it still showed a clear PET signal.
Two caveats matter for US buyers. First, the 2018 bottles came from nine countries, so a brand’s number may not match the bottle on your local shelf. Second, a brand missing from a test isn’t a brand that passed one. Poland Spring and Aquafina weren’t in the 2026 test, so it tells you nothing about them.
So does Dasani have microplastics? In the 2026 test, yes. It scored highest of the seven, but only two points above Liquid Death’s 141. That doesn’t make it uniquely bad. Every brand in that test was positive.
Where the Particles Come from
The 2018 authors concluded that the packaging and bottling process likely contribute more than the source water. That points at the bottle, the cap and the factory line, not the spring.
The bottle itself is the obvious suspect. Most bottled water is packaged in PET, and in the 2026 test the dominant fluorescence signature in every brand matched PET.
The cap is another. Among larger particles confirmed as polymer in 2018, polypropylene was the most common type at 54%, which matches the plastic used in bottle caps. Fragments were the most common shape (66%), followed by fibers.
The bottling process adds a little too. About 4% of the larger particles showed industrial lubricants.
Some people also blame heat, sunlight and repeated cap twisting. These tests didn’t establish that, but keeping bottles out of a hot car costs you nothing.
Packaging Compared: Plastic, Can or Glass
Glass looked better in 2018, but a can scored about the same as plastic in 2026, so neither is proven clean. Glass is the best-supported improvement, though the evidence is thin.
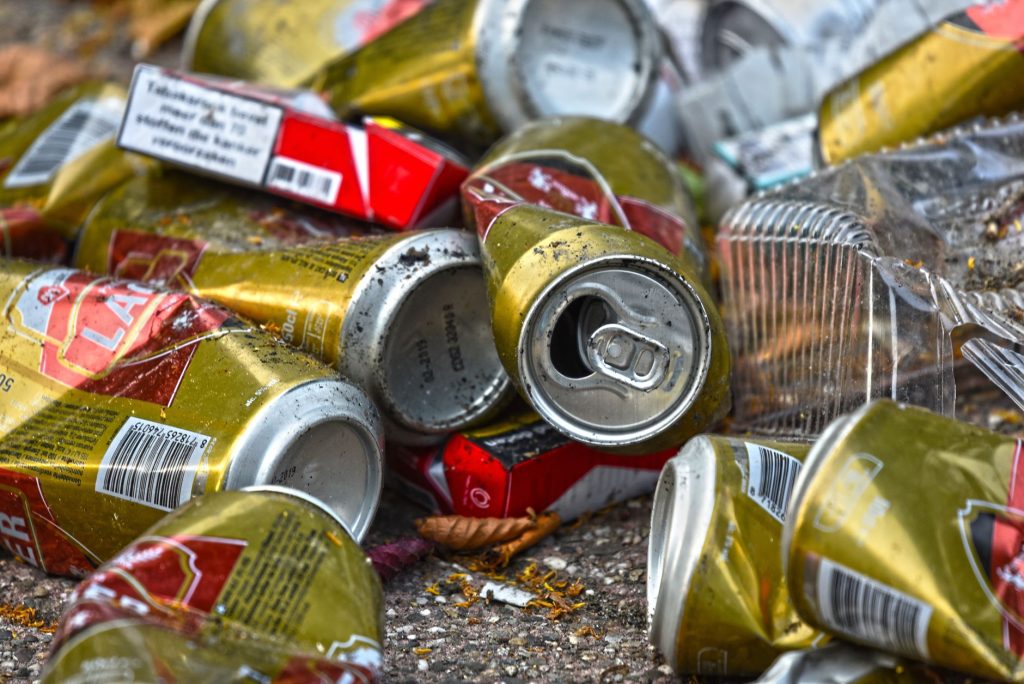
In 2018, nearly every brand was sold in plastic. Only one brand was also sampled in glass, and that water in glass had considerably less microplastic contamination than the same brand in plastic. That’s one brand, which is a hint, not a rule.
In 2026, Liquid Death in an aluminum can scored 141, essentially level with Dasani’s 143. A can doesn’t look like a clear escape from plastic particles in that test.
Why the mismatch? The studies used different methods and small samples. Many bottle caps include plastic parts, and cans typically have a polymer lining inside, so either could shed something. Nobody has tested those pathways well enough to say.
The practical verdict: glass bottles likely help, and cans are unproven. If you buy bottled water and have the choice, glass is the safer bet. Just don’t mistake “better” for “clean.”
Convenience: Bottled vs Filtered Tap
Filtered tap costs a fraction of bottled and cuts plastic contact, but filters differ and none is proven to remove every particle. You’re trading grab-and-go ease for a small amount of routine.
Bottled water wins on convenience. You pick it up and go, with nothing to maintain. It also costs much more per liter than anything from your faucet, and that gap adds up fast for a household that buys cases weekly.
Filtered tap asks for a habit. A pitcher is the cheapest way in, but you refill it and replace cartridges on schedule. Carbon block filters, usually under the sink or in a pitcher, are a common choice. Reverse osmosis systems are more involved to install and use a membrane that needs servicing. Either way, many filter housings are plastic, so follow the replacement schedule and don’t stretch it.
There’s an evidence gap here. Few tests compare filtered tap with bottled water directly, so nobody can promise filtered tap is lower in particles. The reasoning is simpler: you skip a sealed plastic bottle and cap, and you control the container you drink from.
Health Risk: What We Know and Don’t
Researchers have raised concerns that microplastics may fuel inflammation, disrupt hormones and affect immune function, yet scientists don’t yet know what long-term exposure does to people. That uncertainty cuts both ways, so there’s no reason for panic and no reason to shrug.
The World Health Organization announced a health-risk review of microplastics in drinking water after the 2018 findings. Without an established limit for microplastics in drinking water, a lower reading can’t be called safe, only lower.
Two related stories get mixed up with this one. First, Consumer Reports found PFAS, a group of long-lasting chemicals, in several sparkling waters. Topo Chico was highest at 9.76 ppt, followed by Bubly Blackberry (2.24 ppt), Poland Spring Zesty Lime (1.66 ppt), Canada Dry Lemon Lime (1.24 ppt), LaCroix (1.16 ppt) and Perrier (1.1 ppt). That’s a separate contaminant, not microplastics.
Second, several consumer lawsuits have targeted the companies behind Arrowhead, Crystal Geyser, Evian, Fiji, Ice Mountain and Poland Spring. Six cases in all lean on microplastics research such as the 2018 study. But a complaint is an allegation, not a test result, and it doesn’t rank those brands against anyone else.
Which Should You Choose?
For most households, filtered tap water in glass or stainless steel is the better default. Treat bottled water as a backup that you store carefully. That covers nearly every situation.
Everyday household: filtered tap in a glass or stainless steel container. Frequent bottled-water buyer: change the habit first and the brand second, since no brand has a verified edge. Travel or emergency: choose glass if it’s available, keep bottles cool and out of direct sun, and don’t refill and reuse single-use plastic bottles.
Here’s a swap plan you can finish in a weekend:
- Pick a filter. A carbon block pitcher is the easy start. Move to an under-sink carbon block or reverse osmosis system if you drink a lot of water.
- Pick a bottle. Stainless steel or glass, with a cap you can wash. Skip plastic for daily use.
- Set a refill routine. Fill the pitcher every night and a bottle each morning, and put the filter change date on your calendar.
- Keep a small backup. Store a few bottles of water, ideally glass, somewhere cool and dark for outages.
Limits of the Data
Every result here comes from small samples, a single date and no agreed testing standard, so treat brand findings as snapshots. Use them to get a sense of the pattern, not to crown a winner.
- 2026 test: the scores measure signal strength, not particles, and the method can’t detect nanoplastics.
- 2018 test: particles from 6.5 to 100 µm were identified by Nile Red dye uptake, not confirmed by spectroscopy. About half of the larger particles were confirmed as polymer by FTIR.
- Time: bottles on shelves today may differ from those tested, and one past test doesn’t describe your next purchase.
The Bottom Line: Lower Isn’t Clean
All the brands tested were positive, and the rankings can’t be compared across studies, so there’s no winner to buy. Put your effort into the container habits above, not into hunting for a brand.
Check current options, prices and reviews for stainless steel water bottles side by side before deciding what fits your home best.
As an Amazon Associate, Clean Water In Homes may earn from qualifying purchases.
Frequently Asked Questions
Should I stop drinking bottled water because of microplastics?
You don’t need to panic, since health effects are still unproven. If you drink it daily, though, the swap plan above is cheap and easy. For the occasional bottle, don’t lose sleep.
Do reusable plastic bottles shed particles too?
Possibly. Bevi, a water-dispenser company, argues that reusable plastic bottles, including Tritan, shed particles, and that heat, dishwashing and opening the cap can release more. It has a commercial interest in saying so. Stainless steel or glass sidesteps the question.
Is sparkling water better or worse for microplastics?
The tests covered here didn’t separate sparkling from still water. San Pellegrino was positive in 2026, and the PFAS findings in sparkling waters from Consumer Reports are a separate concern.
Sources and further reading
- Synthetic Polymer Contamination in Bottled Water – PMC (pmc.ncbi.nlm.nih.gov)